Energy Bills And ROI
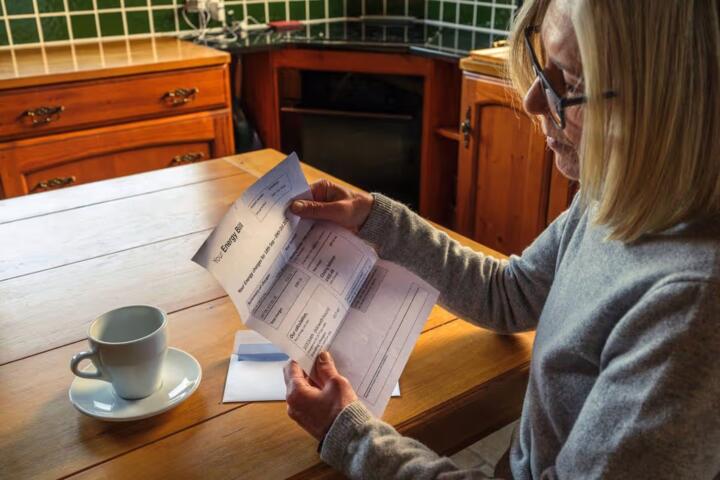
Energy efficiency upgrades reduce the energy you buy, but ROI depends on the gap between your current performance and the post-upgrade performance you actually achieve. In 2026, the calculation still starts with your utility bill history, then maps each upgrade to the specific end uses it changes: space heating, cooling, hot water, ventilation, and plug loads. A practical example: replacing a furnace filter and sealing a few air leaks can reduce heating demand, while adding insulation changes heat loss more permanently. ROI also depends on the price you pay per kWh or per therm, which varies by tariff and sometimes by time of day.
To keep the math grounded, separate “savings” from “cost.” Savings come from reduced consumption, not from marketing claims about comfort. Costs include equipment, labor, permits, and any required maintenance. If you live in a region with weather-driven rates or seasonal demand charges, the same kWh reduction can translate into different bill reductions. That is why two households with identical equipment can see different payback timelines.
One small detail that often changes results: utility bills sometimes show usage in different units across years, and the conversion can be wrong in spreadsheets. If your bill lists therms for gas and kWh for electricity, convert carefully before comparing. I’ve seen people mix calendar-year totals with “billing cycle” totals, which shifts the baseline by weeks and changes the weather normalization.
Where ROI Estimates Go Wrong
Many estimates fail because they treat an upgrade as a single number instead of a chain of assumptions. The chain usually includes baseline energy use, expected savings percentage, installation quality, and how long the savings persist. If any link is off, the payback estimate drifts. A common mistake is using a generic “X% savings” figure without checking whether it matches your climate zone, equipment type, and ductwork condition.
Another pain point is dependency on supporting systems. A high-efficiency heat pump can underperform if the home has leaky ducts, poor insulation, or inadequate ventilation control. Similarly, LED lighting savings depend on how many hours the lights run and whether occupancy patterns change. Hot water savings depend on the incoming water temperature, the distribution piping insulation, and whether the household uses hot water in short bursts or long draws.
People also misread incentives and tariffs. Rebates may cover equipment but not labor, and some programs require pre-approval or specific equipment certifications. Time-of-use rates can change the value of load shifting, but the benefit depends on whether you can schedule thermostats, water heating, or EV charging. If you have a smart thermostat, check the version and firmware; features differ across models, and a “schedule” that worked in an older app may not map to the same control logic after an update (I noticed this after updating a thermostat app to version 3.2.1 in 2025, and the schedule UI changed).
Finally, measurement errors can swamp the savings. If you do not measure before and after, you cannot tell whether the upgrade worked or whether weather changed. Weather normalization is not optional when comparing winter bills to summer bills. Even within a season, a mild year can make a “savings” claim look better than it is.
Efficiency Upgrades With Real Payback
Start With A Measured Baseline
Before buying anything, collect 12 months of utility data if available, then segment by fuel type. For electricity, use kWh totals; for gas, use therms. If your utility offers interval data, download it and compare daily or hourly patterns; this helps identify whether heating or cooling dominates. Tools like ENERGY STAR’s Home Energy Yardstick can help with benchmarking, but the key is your own baseline, not a national average.
Then estimate end-use shares using either a home energy audit or a simple proxy. Example proxy: if your gas bill is mostly winter and your summer gas use is low, space heating likely dominates. If you have a heat pump, look for seasonal changes in electricity use. A mild but practical step is to run a “bill-to-load” check: compare your thermostat runtime (if available) to the electricity consumption during the same days. When the numbers do not line up, the baseline is probably wrong.
Realistic outcome: with a measured baseline, you can usually narrow the savings range enough to decide whether a project is worth quoting. Without it, you often end up with payback estimates that swing by years, because the baseline is doing most of the work.
Pick Upgrades That Match Your Losses
Choose upgrades based on where your home loses energy. Common high-ROI categories include air sealing, attic and wall insulation, duct sealing (when ducts are in unconditioned spaces), and efficient heating/cooling controls. For hot water, pipe insulation and low-flow fixtures can reduce standby and draw losses, while heat pump water heaters can reduce energy use when hot water demand is steady enough.
For air sealing, the “tool” is not a gadget; it is a blower-door test and a targeted plan. If you cannot get a blower-door test, you can still do smoke testing and infrared scans, but those are less definitive. For insulation, verify the existing R-value and the installation depth; contractors sometimes top up without correcting gaps around wiring and plumbing penetrations.
Realistic outcome: air sealing and insulation projects often show measurable reductions within the first heating season, but the magnitude varies with climate and how leaky the home is. If your home already has tight construction, the payback can be slower than expected. If your home is drafty, the payback can be fast, but only if the work is actually sealed, not just “promised.”
Model ROI With Incentives And Tariffs
ROI modeling in 2026 should include three inputs: your installed cost, your expected annual energy savings, and the net cost after incentives. Incentives can include federal tax credits, state rebates, and utility programs, but eligibility rules differ by equipment type and sometimes by installation date. For example, federal tax credits for certain home energy improvements have specific requirements and documentation steps; you need the exact program rules for your address and the year of installation.
Tariffs matter because they change the $ value of kWh saved. Under time-of-use rates, savings during peak hours can be worth more than the same kWh off-peak. If you have an EV, the charging schedule can also change your electricity profile, which affects how much “headroom” your home has for heat pump water heating or space conditioning. A mild frustration: many ROI calculators ignore demand charges and assume a flat rate, which can misstate results for some utilities.
Realistic outcome: with correct tariff inputs and documented incentives, you can estimate a payback window rather than a single point. A useful target is to compute a low, medium, and high savings scenario based on your measured baseline and conservative performance assumptions.
Verify Quotes With Performance Evidence
When you get quotes, ask for documentation that links equipment ratings to your home. For HVAC, request the system’s efficiency rating and the design assumptions used for sizing. For insulation and air sealing, request the scope details: where sealing occurs, what materials are used, and whether a blower-door test is included. For heat pump water heaters, request the expected performance at your local inlet water temperature and the venting approach.
For measurement, ask whether the contractor will provide pre- and post-install testing. In HVAC, that can include duct leakage testing and combustion analysis where relevant. In building envelope work, blower-door results are the most direct evidence. If the quote does not mention any verification, you can still proceed, but you should treat the savings estimate as less certain.
Realistic outcome: verified projects usually reduce the “installation quality” uncertainty, which is one of the biggest reasons real savings diverge from marketing claims.
Case Examples For 2026 Decisions
Example 1: Ducts And Heating Bills
A homeowner in a cold climate has a gas furnace and ducts in an unconditioned attic. Their last 12 months show winter gas use that dominates the bill, and their thermostat cycles more than expected. A blower-door test finds measurable leakage, and a duct test shows high leakage to the attic. They seal ducts and add attic insulation to reach a higher R-value, then retest with blower-door and duct leakage measurements.
In this scenario, the ROI depends on how much duct leakage was present and whether the insulation work reduced heat loss from the attic. The homeowner sees lower winter gas use within the first heating season, but summer bills change little. The payback estimate improves because the project includes verification tests, which reduces uncertainty about “did the work happen.”
Example 2: Heat Pump Water Heater With TOU Rates
A household with moderate hot water usage installs a heat pump water heater and shifts some hot water heating to off-peak hours using a compatible controller. Their electricity tariff uses time-of-use pricing, and their interval data shows that peak rates apply during late afternoon and early evening. They also insulate hot water pipes in the basement and replace a failing mixing valve that caused temperature swings.
The ROI improves because the project reduces electricity consumption and aligns operation with cheaper periods. The household still needs to monitor performance because hot water demand patterns can change with occupancy and laundry schedules. In a mild winter, savings can be smaller than expected if the inlet water temperature is already favorable, which is why the household compares month-by-month results rather than relying on one bill.
ROI Checklist And Comparison Table
Use this checklist to decide whether an efficiency upgrade is likely to pay back in a reasonable timeframe. The goal is decision support, not promotion.
| Upgrade Type | What It Changes | ROI Drivers | What To Verify |
|---|---|---|---|
| Air Sealing | Reduced infiltration and drafts | Leakiness, climate, heating runtime | Blower-door pre/post results |
| Insulation | Reduced conductive heat loss/gain | Existing R-value, thermal bridging | Installed depth and coverage details |
| Duct Sealing | Reduced conditioned air loss | Duct location, leakage rate | Duct leakage test before/after |
| Heat Pump Water Heater | Lower hot water energy use | Hot water draw pattern, inlet temp, TOU rates | Performance assumptions and controls |
| Heat Pump HVAC | Lower space-conditioning energy | Sizing, insulation level, defrost behavior | Manual J sizing and commissioning |
Step-by-step checklist for ROI modeling:
- Collect 12 months of bills and convert units consistently (kWh and therms).
- Separate baseline by season and identify the dominant end use.
- List each proposed upgrade and the end use it targets.
- Ask for verification tests or documentation tied to that end use.
- Estimate annual savings using conservative assumptions and your tariff structure.
- Subtract incentives and add any ongoing maintenance costs.
- Compute payback and also compute “savings per year” to compare projects.
- Plan a post-install measurement window to confirm results.
Common Mistakes That Skew Results
One frequent mistake is using “average household savings” instead of your own usage pattern. If your household runs more laundry, showers more often, or keeps the thermostat at a different setpoint, the savings profile changes. Another mistake is ignoring comfort-driven behavior changes after an upgrade. If people raise setpoints because the home feels warmer, energy savings can shrink even when the equipment performs correctly.
People also confuse equipment efficiency with whole-home performance. A furnace with a high AFUE rating does not guarantee low gas use if ducts leak or if the thermostat schedule is aggressive. Similarly, a heat pump’s rated COP does not match real conditions when the system is oversized, when defrost cycles increase runtime, or when the home envelope is leaky. A mild frustration: some quotes list equipment ratings but omit sizing and commissioning details, which are the parts that determine real-world savings.
Another error involves incentives and documentation. Some rebates require proof of pre-approval, specific model numbers, or third-party verification. If paperwork is missing, the incentive can be delayed or denied, which changes ROI. Finally, measurement mistakes happen when homeowners compare bills without accounting for weather. Comparing winter-to-winter with the same months helps, but the best practice uses interval data or normalized methods.
FAQ
How Do I Estimate Savings From Insulation?
Start with your current heating and cooling energy use, then adjust for your climate and the insulation R-value you plan to add. Use contractor-provided scope details and verify installed depth and coverage, then compare normalized winter and summer bills after installation.
What Payback Period Is Typical In 2026?
Payback varies by climate, utility rates, and installation quality. Projects with measurable air sealing and insulation often show faster payback than equipment-only upgrades when the baseline is leaky or poorly insulated, but you should model low/medium/high savings using your own bills.
Do Utility Rebates Change ROI Calculations?
Yes, because rebates reduce net cost. Include the rebate amount, eligibility conditions, and timing; delayed incentives can affect cash-flow even if the long-term ROI improves.
How Can I Confirm An Upgrade Worked?
Use pre- and post-install measurements when possible: blower-door and duct leakage tests for envelope and duct work, and interval data for electricity or gas consumption. Compare normalized seasonal usage rather than single bills.
Are Heat Pump Water Heaters Worth It For All Homes?
They tend to work best when hot water demand is frequent enough and when the unit’s operating conditions match the installation location. Tariff structure and inlet water temperature affect results, so model savings using realistic performance assumptions and your usage pattern.
Author's Insight
ROI for energy efficiency upgrades is a measurement problem as much as a purchasing decision. The most reliable estimates start with your own bill data, then connect each upgrade to the end use it changes and the verification tests that confirm installation quality. Incentives and tariffs can shift payback by changing net cost and the dollar value of saved kWh, so ROI models should include those inputs rather than using flat-rate assumptions. When quotes omit sizing, commissioning, or pre/post testing, the savings range widens, and the payback estimate becomes less trustworthy.
For 2026 planning, the practical next step is to request documentation that ties performance to your home and to plan a measurement window after installation. If you can’t get verification tests, you can still proceed, but you should treat savings as uncertain and avoid relying on a single-point payback number.
Key Takeaways
- Model ROI from your bills and your tariff, then map each upgrade to the end use it targets.
- Installation quality and verification tests often determine whether savings match expectations.
- Incentives change net cost, while time-of-use rates change the $ value of saved energy.
- Compare normalized seasonal usage after installation to confirm results and refine future decisions.